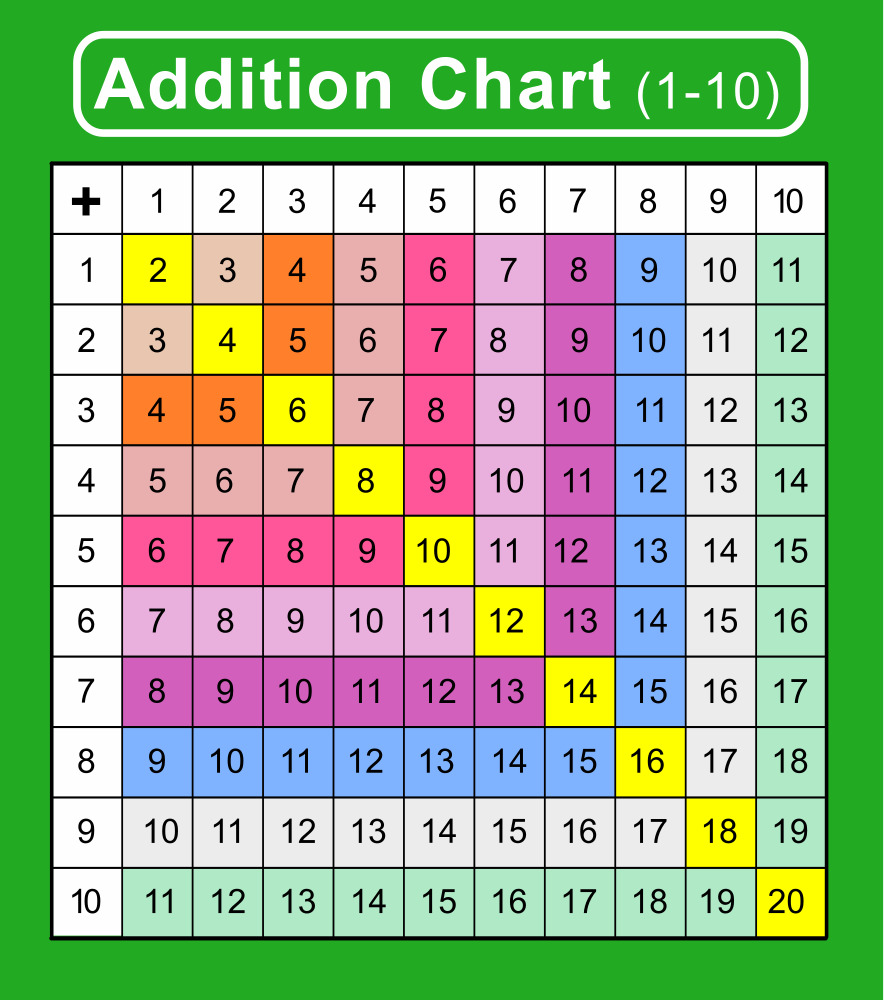
Addition: best teaching chart on addition
There are many effective teaching charts for addition, and the best one depends on the individual learning style of the student. However, some popular options include:
1. Counting Chart: A counting chart can be a great tool to help students visualize addition by physically counting out the numbers.
2. Number Line: Using a number line can help students understand the concept of adding by showing how the numbers increase or decrease as they are added together.
3. Arrays: Arrays can be used to show how adding groups of objects works and can be a useful tool for visual learners.
4. Flashcards: Flashcards can be used to practice addition facts and can be customized to fit the student’s needs.
As for references, there are many resources available online that provide detailed information about different teaching charts for addition, such as the following:
* “Using Visuals to Teach Addition” from Scholastic
* “Fun Ways to Teach Addition” from Education.com
* “Teaching Addition with Manipulatives” from Teachers Pay Teachers
It is important to note that while these resources may provide useful tips and strategies for teaching addition, it is always best to tailor your approach to the specific needs and learning styles of each individual student.
- About us
- Adding
- Additio | Addition Charts
- Addition | Addition Charts
- Addition Equations equal to 10
- Addition Square
- Addition Worksheets | Addition Charts
- Additions | Addition Charts
- Adicion
- AI addition learning helper
- Engaging Addition Games: Unlock Math Skills for Kids
- Free Printable Addition Tables (1-12) | Addition Charts
- Free Printable Addition Tables for Kids: Master Math from 1 to 10 Easily
- Free Printable Addition Worksheets (1-12) | Addition Charts
- Free Printable Addition Worksheets: Various Styles for Effective Practice | Addition Charts
- Number decomposition
- Number decomposition solution
- Pluss
- Privacy Policy
- Privacy Policy
- Same number Addition Equations
- Snake game
Similar website
0 Comments